I Taught an AI to Read My Logs (So I Don't Have To)

I developed an AI assistant that translates technical system logs into plain, understandable language. This transforms the tedious task of manual log scanning into a source of proactive, conversational insights.

Log files are invaluable for debugging and understanding system behavior. They contain detailed records of what your system is actually doing, but monitoring them continuously requires dedicated attention to timestamps, status codes, and technical details. For my complex project with multiple interconnected services, I saw an opportunity to use AI as a dedicated employee focused solely on monitoring system performance.
The solution seemed obvious: instead of me interpreting the logs, why not have the system explain what's happening in plain language? Not technical jargon, but clear, actionable information from a capable assistant who understands the context.
Step 1: Defining the Assistant's Character
The foundation wasn't code—it was personality. Generic monitoring tools already exist, but they lack context and nuance. Using a system prompt to configure a custom AI model, I established its core identity: sharp, helpful, and conversational. The critical requirement was synthesis over repetition. Instead of parroting "Process exited with code 0," I wanted it to conclude "The last job completed successfully."
Step 2: Building the Infrastructure
With the AI's behavior defined, I created a Python script to serve as its operational framework:
- Continuous terminal operation for real-time monitoring
- Periodic background scanning of the most recent log entries across all system components
- Intelligent aggregation of raw technical data into coherent packages
- Direct communication with my locally-hosted AI model (via Ollama) for intelligent analysis of the aggregated data
Step 3: Iterative Refinement
The initial implementation revealed the challenge of working with generative AI: over-interpretation. The assistant, eager to be helpful, would confidently report on metrics that simply don't exist in operational logs—user engagement, download statistics, and other fabricated insights.
The solution required more precise constraints. I updated the core instructions with very explicit boundaries: "Base all statements strictly on the provided log data" and specific prohibitions against inferring non-existent metrics. Squelching the model's creativity with a rock-bottom temperature setting also helped.
Equally important was teaching the system to distinguish between noise and signal. Not every "ERROR" entry represents a crisis. A temporary network timeout is fundamentally different from a missing API key. The refined logic now categorizes issues by actual impact, allowing for appropriately calibrated responses.
Step 4: Creating an Engaging Interface
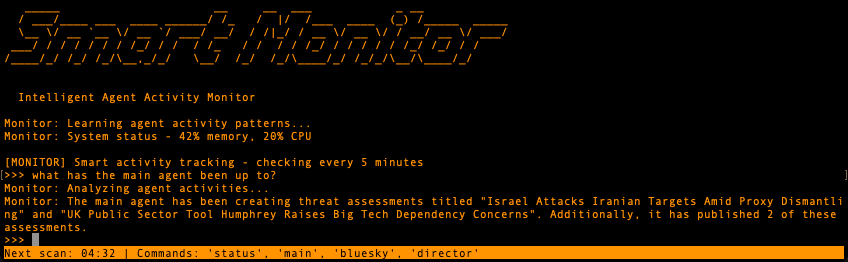
The user experience needed to match the assistant's capabilities. A basic command prompt felt inadequate for something designed to be conversational and proactive. Using Python's prompt_toolkit, I built a terminal application with visual presence—custom ASCII branding and a live countdown timer showing when the next scan will occur.
This interface allows the background monitoring to provide updates without interrupting active work, creating the feeling of a genuine collaborative partner rather than a passive tool.
The Outcome
What emerged is fundamentally different from traditional monitoring solutions. This isn't just alerting when something breaks—it's ongoing situational awareness delivered conversationally. The assistant proactively surfaces important developments and responds to direct questions with contextual understanding.
The transformation is significant: instead of dreading log analysis, I now have an informative dialogue with a system that understands both the technical details and their broader implications. It's the difference between reading raw data and having a knowledgeable colleague explain what's actually happening.